You Grew Faster Than
Your Systems Did

Predien delivers the analytical infrastructure the mid-market companies need: your existing data, connected and turned into decision-ready answers, without a new system to implement.

Your business questions

  • Which accounts make us money? Ranked by margin, live
  • What does labor cost per unit? $1.42, against your $1.30 threshold
  • Did we bill everything? Three gaps caught before invoicing

Predien the platform, plus the forward deployed analyst

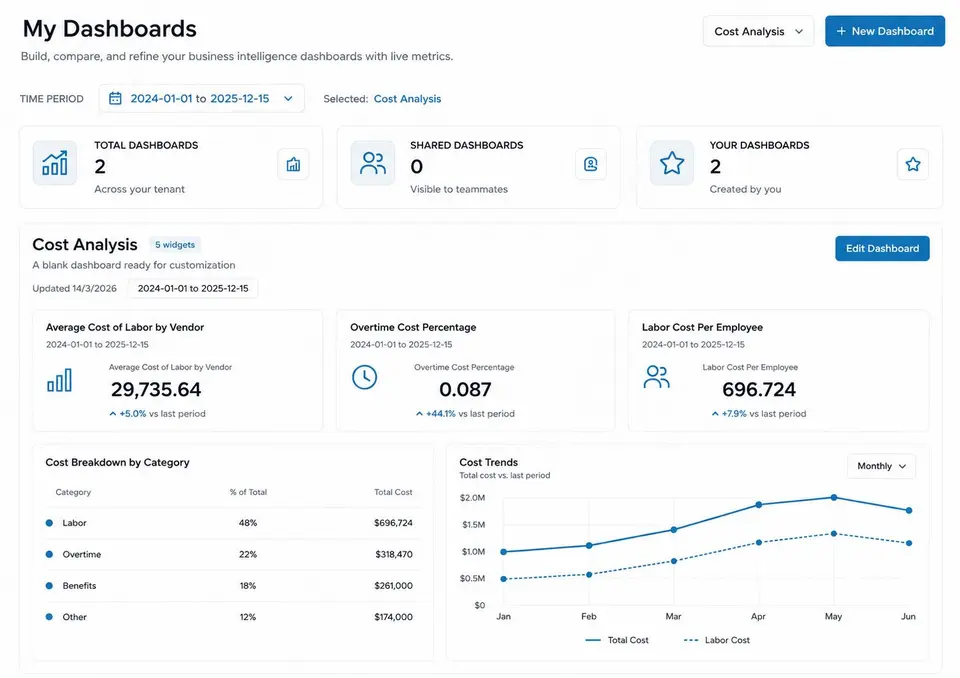
Predien dashboards with live operational metricsForward deployed analyst reviewing operational data

Actionable insights.
Deployed where you work.

  • ERP
  • WMS
  • Payroll
  • Billing
  • Spreadsheets
Watch the Demo

You have the data. You don't have the team to work on it.

Predien is built for mid-market companies with operational complexity and inadequate analytical infrastructure. It is a decision infrastructure problem to make faster business decisions.

Skip the Wait: Start on Day One with Predien
Traditional Waiting TimeBusiness Problem
Hiring a team of analysts in 60-90 days

Every time we hire a data analyst, we go through the same cycle: job description, search, weeks of onboarding, and learning. A year later, all their knowledge, reports and processes live only in their heads. If they exit, we lose that knowledge overnight.

Buying & Finalizing reporting tools in another 60 days

Buying a reporting tool just gets you an empty shell. The real work is deciding what to track, building the reports, and keeping them up to date which falls on someone inside your business who's already stretched thin.

Stay in spreadsheets

They're familiar and free. Formulas break, only one person understands how it all works, and there's no way to trace how any number was calculated.

Predien is the predictive decision intelligence layer that's ready to go from day one, with a forward deployed analyst running it for you as soon as you're on board.

Request a live walkthrough
Aerial view of a distribution facility

Why leaders choose Predien

Predien is a predictive decision intelligence platform helping leaders understand what could happen next, identify the business impact, and decide what to do before pressure becomes an operational crisis. Unlike software-only solutions, Predien combines scenario-driven technology with a complete analytical infrastructure that is operational from day one.

Our forward deployed analysts ensure data readiness and deliver actionable, decision-ready analysis, so you can focus on taking the right action on time rather than managing another technical platform.

Wired: Your systems connected into one model

Your forward-deployed analyst pulls data from your ERP, warehouse, workforce, and billing systems, then improves readiness, cleans inconsistencies, configures scenarios, reviews outcomes, provides recommended actions, and ongoing decision support. Labor, throughput, billing, and margin all connect in one place, so you can test decisions before they happen, without building or maintaining the infrastructure yourself.

Today: the export folderlabor_v3_FINAL.csv

Exported Tuesday. Edited Thursday. Emailed twice.
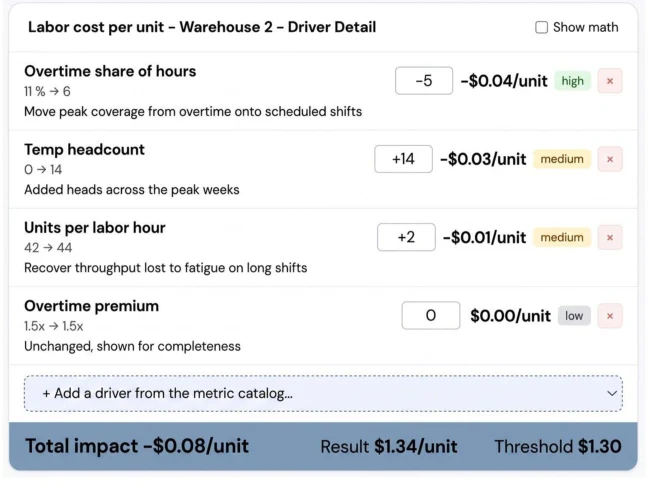
Labor cost per unit driver detail for Warehouse 2, with the total impact against the threshold
Structured by the forward deployed analyst, in your categories

Watched: Every
metric monitored for you

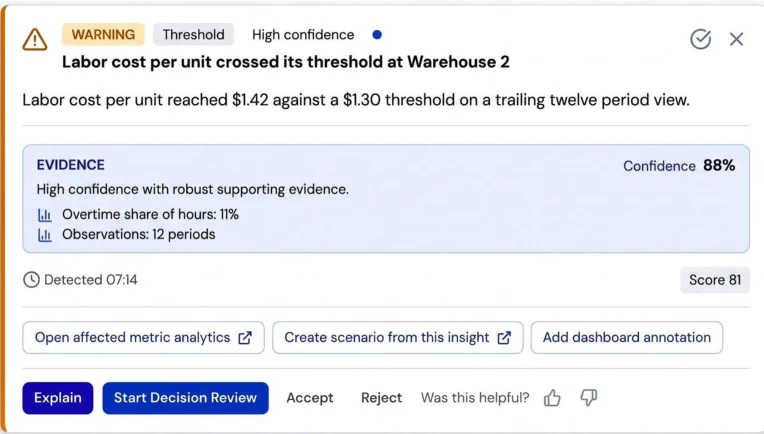
Every metric is tracked against the limits you set. AI monitors it around the clock, while your forward-deployed analyst cuts through the clutter and sends you only the signals worth acting on, each with a suggested next step. That's predictive decision analytical infrastructure doing the monitoring, so your team doesn't have to.

Today: the ad-hoc askRe: can you pull the overtime numbers?

By Thursday if possible. Want to sanity-check peak staffing before the schedule goes out.

Threshold warning that labor cost per unit crossed its threshold at Warehouse 2, with evidence and actions
26 detected this week, 6 published by the forward deployed analyst, before you asked

Decided: Change One Business Metric, See What Happens

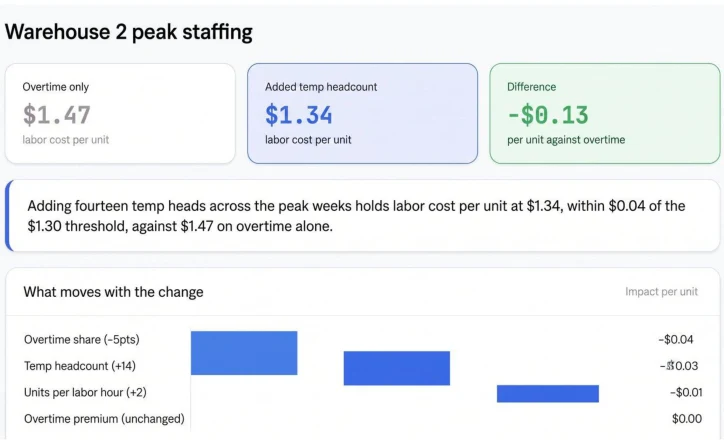
Change one business metric and see how it affects everything linked to it. Compare two options side by side. What you get is a decision tested against your own numbers with every assumption, and the reasoning behind it.

Today: the gut feelWH2 peak. Overtime again, or temps?

Feels like temps this year. Ask around for what we did in 2024.

Warehouse 2 peak staffing comparison of overtime only against added temp headcount
Both options priced on the model, framed by the forward deployed analyst

Predien looks at your data. It never touches or changes your system. Nothing in your operation slows down or waits for us.

See the difference between a spreadsheet and a live scenario model of your business

Take one metric (e.g. labor cost per unit). In a spreadsheet, it is a labor cost someone exported last week. However, in Predien it is live, pulled straight from payroll and your warehouse system, and checked against the threshold you set on your own tenant.

Spreadsheet (static)
Exported last week

Labor Summary, Julylast edited 11 days ago

AreaHeadsHoursCost
Receiving243,840$142,080
Pick lines416,560$242,720
Pack335,280$195,360
Returns121,920$71,040
Dock182,880$106,560
Overtime, 1.5x2,140$118,770
Agency temps, invoiced$257,000
Taxes and benefits$316,470
Total12822,620$1,450,000

The forward deployed analyst settled the definitions

Labor cost per unit · Warehouse 2

Source A · payroll$1,450,000total labor cost
Source B · your WMS1,020,000units shipped
$1.42
$1.30

threshold, set on this tenant

crossed

live, from your loaded history

This is what predictive business intelligence looks like in practice. The number is current, the source is visible, and you see it cross your line the moment it does. That is the gap between a report and a real decision support platform.

Enter your operating numbers.
This predictive intelligence software does the rest. Try now!

This is a working model of a typical mid-market operation. Change anything below and it recalculates instantly. Nothing you type is stored.

3
235,000
$1,450,000
11%
$7,200,000

Nothing you type is stored.

$1.42

Labor cost per unit at your current mix

What one point of overtime share is worth to you in a month
$6.9K
Labor carried twelve months forward at today's rate
$17.4M
Monthly labor spend at one site, at your current split
$483K

At the revenue you entered, labor is 20.1% of it. Modeled from your inputs. Your real model is built on your loaded history and your own definitions, and it is more exact than this.

What Leaders Test Before They Commit

You test every one of these on your real numbers first, before you ever commit to it. That's operational scenario intelligence, so, try it before you trust it.

Warehouse aisle with stocked pallets
Analyst reviewing a performance chart
Warehouse team walking through a pallet aisle

Start with one real business decision.
4-week sprint to receive a clear answer.

Bring us the business decision you're facing right now. All we ask of you is one short working session each week, no prep required. In four weeks, you'll have a clear answer, tested on your own operating numbers, before committing resources.

  1. The model uses your data, while the forward-deployed analyst works closely with your team to understand how the business operates in practice.

  2. We look closely into the financial drivers of the part of the business affected by the decision, down to where the actual revenue and costs are generated.

  3. We model the options you are considering and compare them using your real business numbers and realistic operating conditions.

  4. You make the decision with the full comparison in front of you, and the reasoning record as you make it.

What You Walk Away With

Useful metrics such as cost per unit, utilization, overtime share and revenue per site, built from orders, labour, revenue and inventory data.

Operational impactThis Month
  • Cost per Unit$1.42Vs Target 20% $ 1.30
  • Capacity82%Vs Target 85%
  • Labour % of Rev.18%Vs Target 20%
  • Service Level96%Vs Target 95%

Target Range

What ifIncrease overtime share+3%
  • Current state$1.18/unit
  • ChangeOvertime Share+3%
  • Predicted outcome$1.42/unit20%

Compare to current state

Analyst reportForward - Deployed Analyst
  • FindingOvertime is increasing cost per unit beyond target.
  • Business Impact+$28,450 / month
  • RecommendationReduce overtime share by 2-3% across Site A and Site B.
  • Next StepReview staffing plan and optimize schedules.

Pricing line: A fixed fee, agreed upfront. If the decision doesn't make sense based on your numbers, you'll know within four weeks before you commit. However, if you continue, the analyst carries the work forward, so nothing needs to be rebuilt or explained again.

Bring the decision you are
weighing right now

See it tested on your own business numbers before you commit.

Who this is for

Predien is built for mid-market leaders whose business has outgrown their current analytical capabilities.

What happens next

Email one line with the decision you are weighing. It goes to the person who would run your Sprint, and they come back within one business day.