Understand In Three Minutes
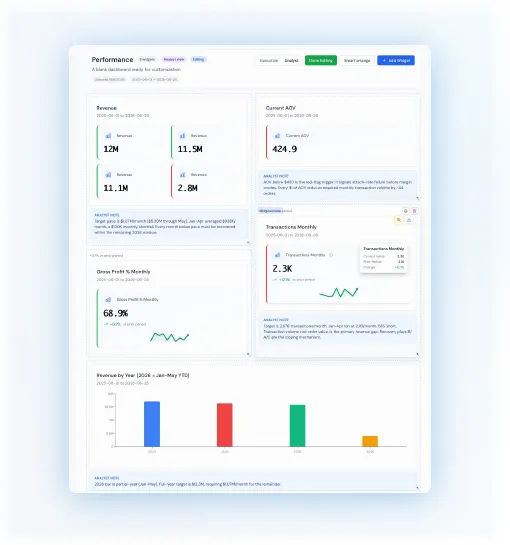
Every KPI card shows the current value, the change from the previous period, a trend sparkline, and a colour-coded status, so executives read the state of the business in under three minutes without clicking anything.

See operational metrics, financial performance, and strategic KPIs unified in a single analytical
model, with every number traceable to its source.
Predien's Decision Intelligence Platform eliminates fragmented reporting and manual
reconciliation, giving leadership a complete view to make decisions at the speed of the business.
Manufacturing leaders make important decisions about costs, production, pricing, and
capacity every day. But when data is spread across plants, systems, and
spreadsheets, understanding what is actually driving a number can take too long.
Every KPI card shows the current value, the change from the previous period, a trend sparkline, and a colour-coded status, so executives read the state of the business in under three minutes without clicking anything.

No standalone figures. If gross margin sits at 34.2%, you also see it is down 2.4% with a declining trend and a red border, so the interpretation is immediate rather than a separate step.

Click any KPI, segment, or calculated metric to drill down to the underlying data. Built on a Decision Modeling Platform, Predien traces every metric back to its source until the root cause is clear.

Selective analyst annotations explain the story behind a number, like a margin dip tied to a negotiated discount, so the context arrives only when it matters and never becomes noise you tune out.
Every scenario and analysis produces structured output automatically: summary metrics up top, detailed breakdowns by time bucket or segment underneath, impact analysis with directional indicators. Export straight into a board presentation or strategy session, no assembly required.
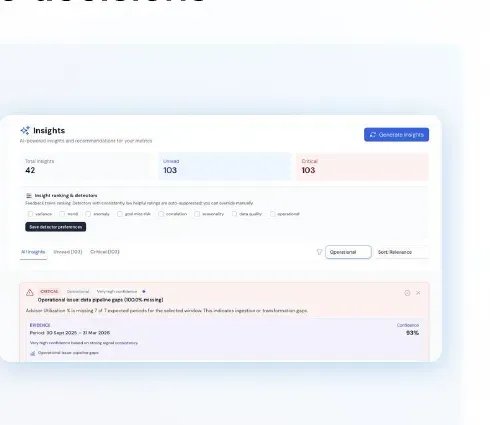
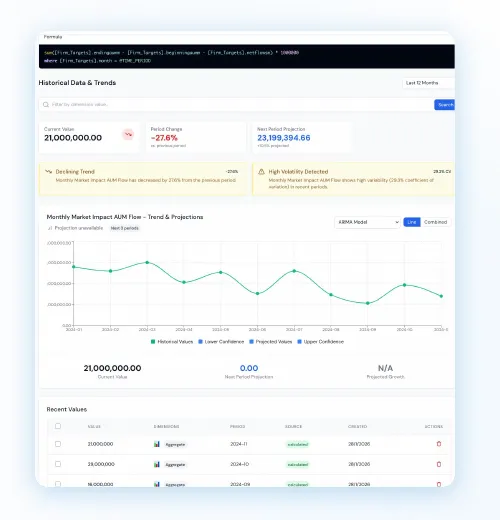
AI Decision Intelligence monitors your metrics continuously for anomalies, emerging trends, and leading indicators, then delivers validated insights directly to your dashboard. No manual reporting, and no searching for answers.
In a normal week the model detects twenty to thirty anomalies. Most are noise: data artifacts, seasonal patterns, corrections that resolve themselves. Your forward deployed analyst reviews each one, confirms which are real, adds the operating context, and publishes the five to seven worth acting on.
Pull a single chart into a board deck or send a full report for a strategy session. PDF, PowerPoint, or CSV, and every export traces back to the same model, so nothing is lost in translation between systems.
Customer profitability, labour and throughput trends, cost to serve, site-level operations, all pulled into a single view, so leadership sees the full picture instead of fragments from disconnected systems.
Every metric computes on the same dimensions and business logic. When a number appears on your dashboard, it matches every scenario, every report, and every insight on the platform.
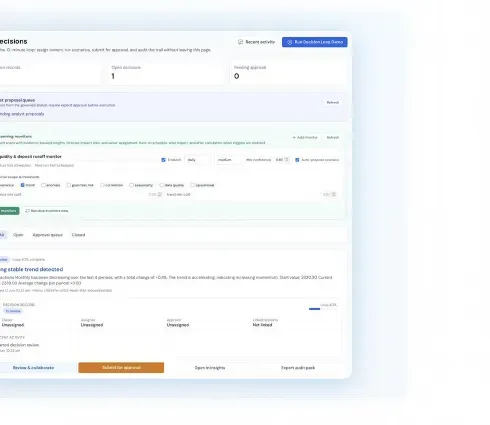
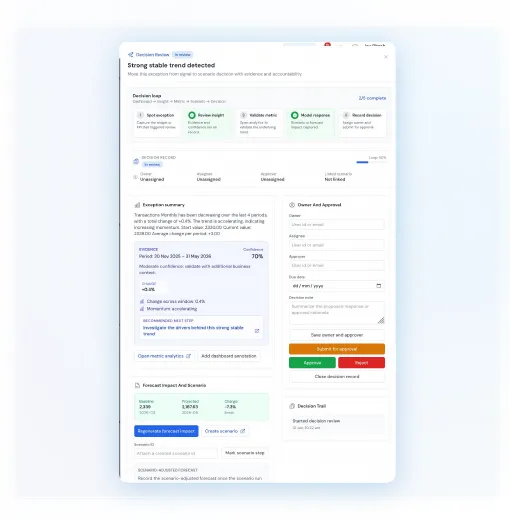
Every decision record carries an owner, an assignee, an approver, and a due date, so nothing sits in limbo waiting for someone to claim it.
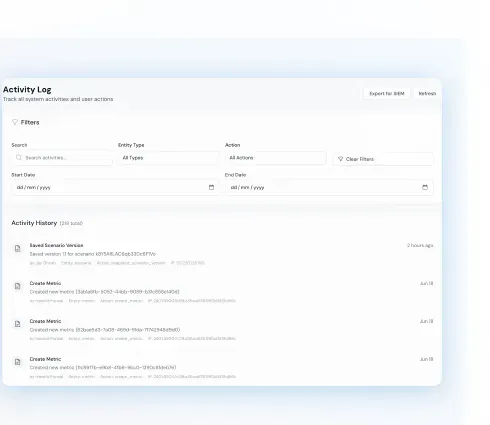
Every action taken on a decision is timestamped and logged: submit, approve, reject, close. The entire history is visible, not just the final outcome.
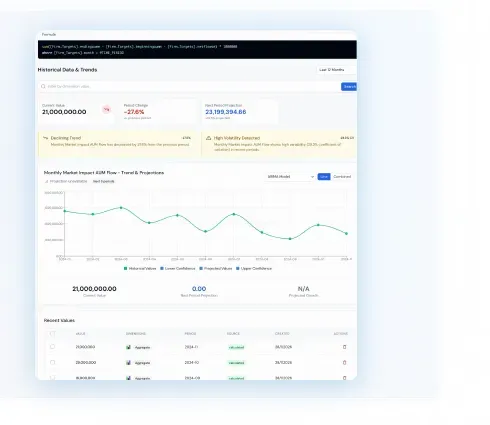
When a KPI flags red or a trend breaks, the platform does not just show you the number. It explains the variance, the contributing factors, and the historical context behind it.
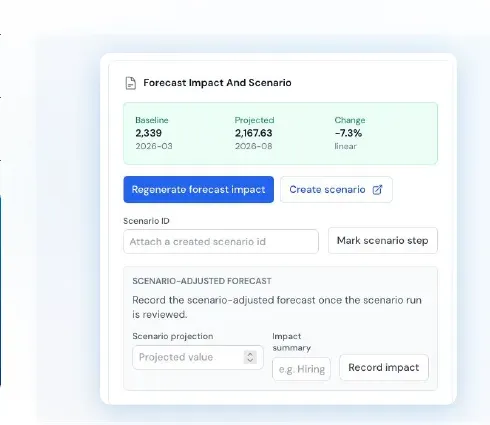
Model the possible responses, then record the chosen one with an owner, due date, forecast impact, and approval status, turning a flagged exception into an auditable decision in minutes.
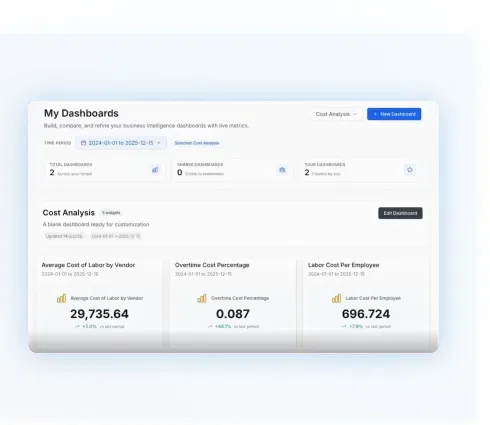

Empower every level of leadership with dashboards configured to how your business operates. Owner, admin, member, or guest, each role sees exactly the view it needs.
Build custom scenarios with base, forecast, or what-if modes, visualise the financial impact through built-in charting, and ask questions in plain language instead of writing a single query.
Predien's Decision Modeling Platform turns raw data into decision-ready dashboards, configured around your business from day one.
Get the Details →Loop completeness scoring
Every decision record is scored from 0 to 100% across five checkpoints: was it triggered from a dashboard exception, is evidence on record, was the metric reviewed, was a scenario modelled, is there an owner and a status. Nothing sits unresolved in the pipeline, and leadership sees at a glance which decisions are fully closed and which still need attention.
Learn more about Decision Governance →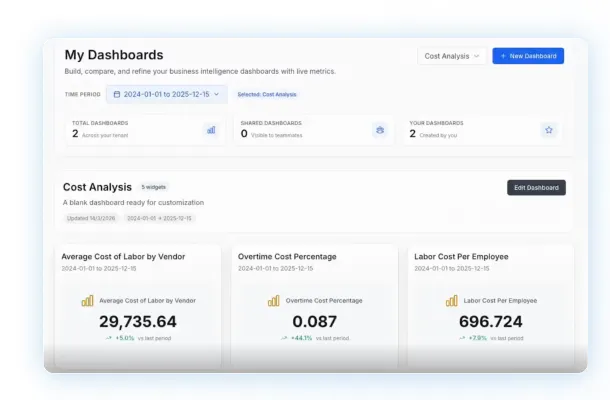
Compliance export
From evidence to approval, every step is captured automatically. Export structured audit packs containing the complete decision history, supporting documentation, and outcomes for internal controls, SOC 2, or regulatory compliance, with a Decision Management System built for enterprise governance.
Learn more about Compliance Export →See it tested on your own business numbers before you commit.
Predien is built for mid-market leaders whose business has outgrown their current analytical capabilities.
Email one line with the decision you are weighing. It goes to the person who would run your Sprint, and they come back within one business day.